On this post we will show you how to track and trace a Linux process on the system with two tools, ps and strace command line tools. This system tools can help you to identify real system process and their origin.
On shared web hosting servers it is very common to face spam and malware issues. This issues can happen due to lot of reasons, and sometimes this outgoing spams or attacks are launched from system processes like perl scripts using lot of CPU resources.
On most of this cases, apparently it is “only” a perl process, but here come a few interesting questions: how do you know where is it coming from? How a Linux system process could mask its real name? What is the most easy and reliable way to find out where this Linux process was started?
Today we will try to answer all this questions with some quick and easy practical examples.
Trace a Linux process using ps command
Let’s see a real life example that happened days ago in a dedicated server I manage.
On one particular website there was an outgoing spam issue that was sending lot of emails, but no malware was found inside the public_html folder, also all email boxes passwords were changed, the same as the FTP/cPanel account password. Still, there was a way the attacker was using the Linux system to send outgoing emails.
The source of the emails was a process running under the “johndoe” user which was appearing to be malicious, and was not what it claimed to be:
[[email protected] ~] ps -U johndoe -u  johndoe u
USER PID %CPU %MEM VSZ RSS TTY STAT START TIME COMMAND
johndoe 59289 4.0 0.0 43568 9528 ? Ss Jun08 110:01 httpd
As you see, the first thing to find out the process was to use the ps command, as you see below:
ps -U user -u user u
Replace “user” with your real system user.
After that, once you have the suspicious processes listed, use ll command to find out more information using its PID, as seen before:
As you see, the process claims to be “httpd” to hide itself (any process can change its own process-title), it is actually a perl process:
[[email protected] ~] ll /proc/59289/exe
lrwxrwxrwx 1 johndoe johndoe 0 Jun 10 10:05 /proc/59289/exe -> /usr/bin/perl*
There was no script file associated with it, however. The script was most likely piped into the perl process to avoid putting anything on the filesystem where it would leave a trace.
I do not know how the script came to be running under this user, but this was a vulnerable WordPress installation with many outdated plugins and injected malware that could easily lead to this kind of issues.
Killing the rouge process was the best thing to do in this case:
kill -9 59289
Replace “59289” with the real process ID.
Strace: another easy way to trace a system process
strace is a very handy and useful tool used by system administrators for debugging and diagnostic system and process related problems where the source is not really clear and available when taking a quick and first look.
This debug tool allows programmers and system users to quickly find out how a program is interacting with the OS. It does this by monitoring system calls and signals.
As we will see in the next examples, strace outputs each line in the trace that includes the system call name, its arguments and the return value (inside the parentheses).
strace example
Let’s run strace against /bin/ls, and save the output into a file called ls.txt
strace -o ls.txt /bin/ls
To read the output, just run:
more ls.txt
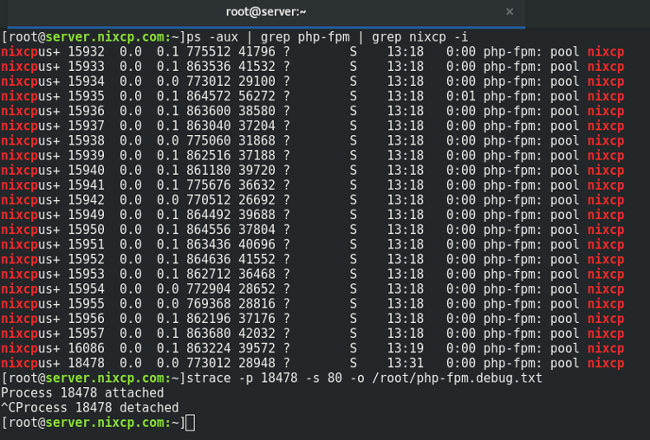
But that is just a basic strace example. The interesting part comes when you can strace the webserver process and find out what it is doing exactly. Let’s take a php-fpm process as example:
strace -p 18478 -s 80 -o /root/php-fpm.debug.txt
[[email protected]:~]strace -p 18478 -s 80 -o /root/php-fpm.debug.txt
Process 18478 attached
^CProcess 18478 detached
[[email protected]:~]
By pressing CTRL + C you will terminate the trace and it will be detached.

You can also specify what you need to trace, for example, if you only need to trace the open and read system calls, you should specify that in the strace syntax, as you see below:
strace -e trace=open,read -p 18478 -s 80 -o /root/php-fpm.debug.txt
This quick strace example used a few command options, exaplained here:
-o filename: used to write the strace output into a file name.
-p PID: here you must specify the system process ID.
-s SIZE: sets the maximum string size to print (32 is the default).
Again, to read the output, just run:
more /root/php-fpm.debug.txt
Now you know how to trace a Linux process easily with two simple commands, with this information you can easily track a Linux process to find out what is doing exactly inside your server. strace takes a little bit more of time to understand from the manual, but it’s the definitive tool to trace a Linux process.
Further reading:
- man strace
- strace hello world
- ps command
